Behind the impressive percentages
Whenever a major model drops, everyone talks about its benchmark scores, debating and comparing them. I’ve run into the same situation more than once: the benchmarks suggest a breakthrough, almost a frontier model for the price of a slice of pizza, but using it is a disappointment from start to finish (unfortunately, this has happened to me especially often with Chinese models).
Of course, in real work, these judgments are very subjective and vary from person to person. But we still need some way to compare models, evaluate them and improve them—which means we need benchmarks. And we need fair, equal conditions for comparison. The test sets themselves should expose real, current problems in their field, rather than being tests for the sake of testing.
But that’s a subject for another day. What a benchmark should look like—say, for coding—and what it should include to assess a model on the tasks programmers face every day is a big topic of its own. It’s a difficult question, and much of it is open to debate. Benchmarks themselves help set the direction for today’s labs, but does a place in a table really determine how good a model is for us, its everyday users? In this article, we’ll look at leading benchmarks: how they work, their subtleties and pitfalls, and the tricks developers use to make a release look better.
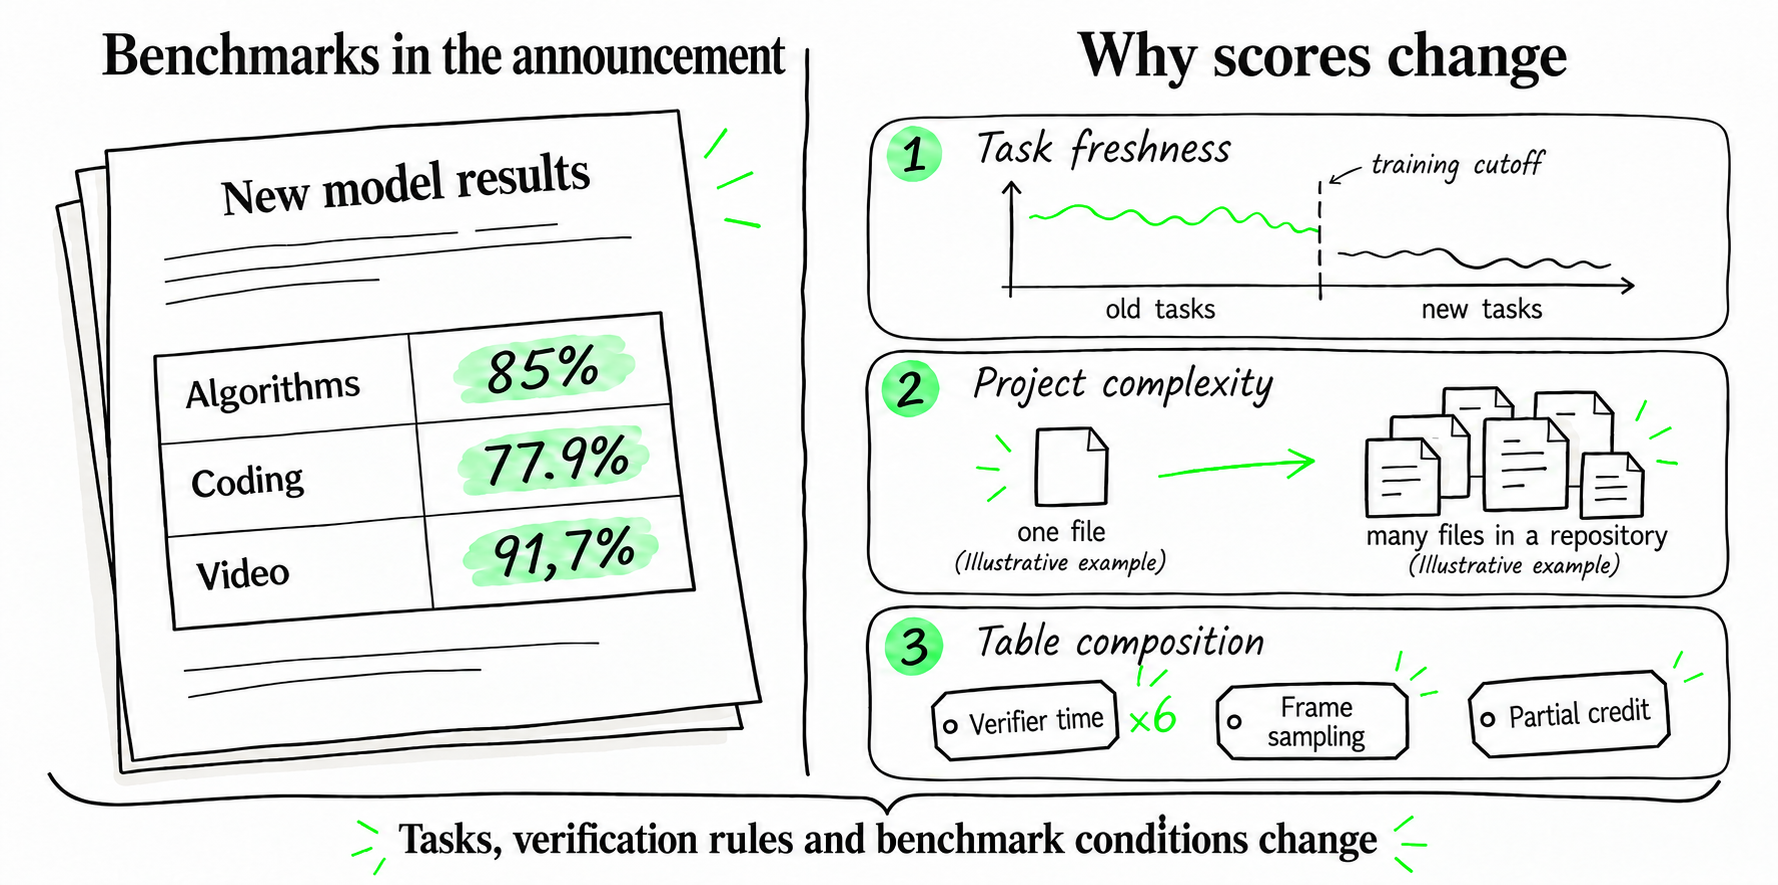
- Old tasks versus new ones (LiveCodeBench monitoring). In presentations, models score 80–85% on algorithmic tasks from LeetCode and Codeforces. The authors of LiveCodeBench split tasks by publication date. They found that high performance holds up until the model’s training cutoff date. On equally difficult competition problems published a couple of months after release, accuracy drops by half: much of what the test measures is memory of solutions from the training data.
- Local edits versus commercial projects (OpenAI’s SWE-Lancer and Scale AI’s SWE-bench Pro). SWE-bench Verified, a popular test on which models solve 75–80% of tasks, consists largely of small, single-file changes in well-known Python libraries (Epoch AI’s analysis). When those same models faced real Upwork contracts and large repositories with dozens of interdependent files in SWE-Lancer and SWE-bench Pro, the share of tasks solved fell to 15–26%.
Similar questions arise within a single table. In the September announcement for Gemini 4 Argon, 91.7% for video understanding sits alongside 19.6% for legal tasks. Read both numbers as the share of correct answers, and it looks as though the model has almost mastered video but struggles badly with documents. Yet the first test checks a single selected answer letter, while the second checks a long list of requirements against a completed contract, where one omission wipes out the score for the whole task.
On October 28, Google introduced Gemini 4 Carbon. The table changed along with the model: some tests disappeared, while others acquired different versions or result sources. Even the older Argon received different numbers in the October table. To understand what changed, we need to understand how these scores are produced.
We’ll do that by examining seven benchmarks from the Argon table: coding, scientific work in a terminal, legal documents, long context, video, computer use and a composite index. In the relevant sections, we’ll also look at Carbon’s results.
Below are selected rows from the original Argon table. The numbers and versions are preserved as they stood at the September release.
| Benchmark | What the system does | Argon | A competitor in Google’s table |
|---|---|---|---|
| DeepSWE v1.1 | Extends an existing project | 77.9% | Opus 5.5 — 74.2% |
| Terminal-Bench Science 0.1 | Performs a scientific task in a terminal | 57.6% | Astra — 68.1% |
| Harvey’s Legal Agent Benchmark | Prepares a legal document | 19.6% | Fable 5.1 — 6.7% |
| GraphWalks, up to 128K tokens | Finds connections in a long text | 99.7% | Astra — 98.7% |
| GraphWalks, 256K–1M tokens | Searches a longer input | 84.2% | Astra — 71.8% |
| LVBench | Answers questions about long videos | 91.7% | Astra — 87.5% |
| OSWorld 2.0, offline snapshot | Performs a task on a computer | 69.2% | Astra — 72.6% |
| Vals Index | Combines results from several tests | 68.9% | Opus 5.5 — 67.0% |
GraphWalks has two rows for different context lengths, so there are eight rows but seven benchmarks. The last column shows individual comparison models chosen by Google itself.
Many of these tests involve an agent: the model receives tools—a terminal, browser or file editor—takes an action, sees the result and chooses its next step. The program that manages this loop and limits its runtime is called a harness. Once the agent finishes, a verifier (or evaluator) checks the result:
Run: task + tools in the harness → agent steps → final artifact (answer, patch or files)
Verification: final artifact → checks under the benchmark's rules → a number in the table
To explain how each test works, I’ll use small examples of my own. They illustrate the task; they are not actual items from private evaluation sets.
DeepSWE v1.1: extend an existing project
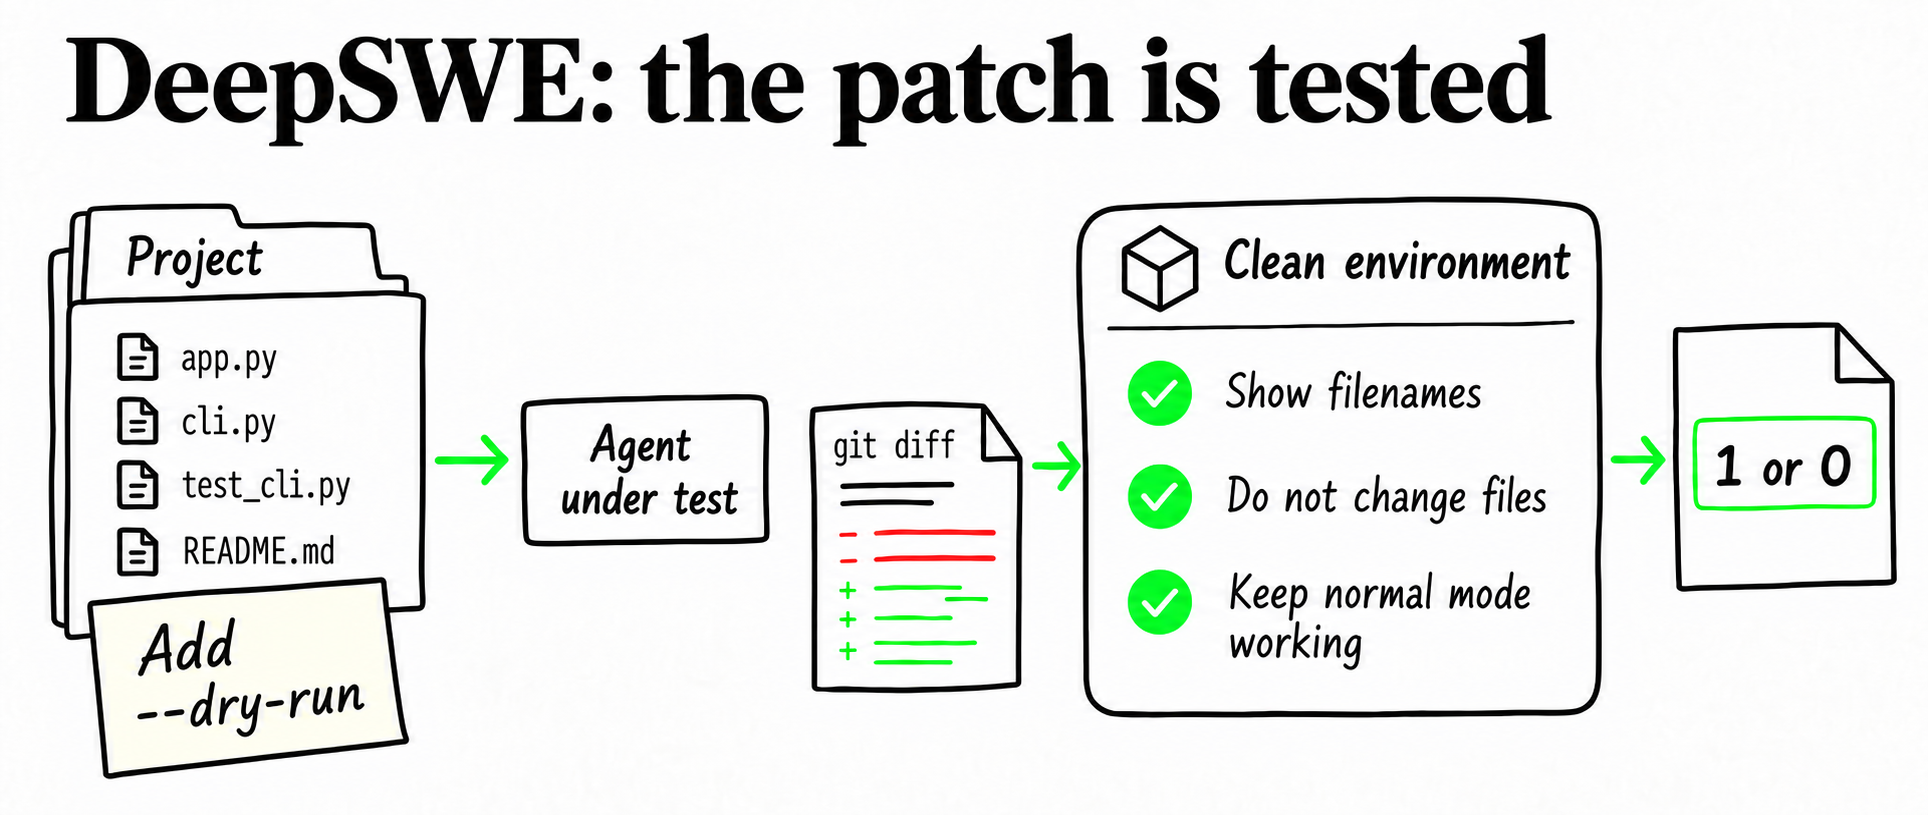
Imagine a command-line utility that batch-renames photos by the date they were taken. Someone opens an issue in the project repository:
Add a
--dry-runflag (preview mode). The program should print the proposed renamings (IMG_01.jpg -> 2026-10-28_01.jpg) without changing the files on disk. Normal renaming without the flag should continue to work as before.
In DeepSWE v1.1, the agent receives a task like this along with the full project repository. It locates the relevant files, reads the existing code, implements the flag, runs the local tests available to it and fixes errors until the program works. At the end, it records its changes in Git.
How verification works:
Task + repository → agent edits code → git diff → clean container + hidden tests → 1 or 0
The evaluator does not read the agent’s reasoning history or trust whatever the agent has configured on its own machine. Verification runs in isolation, in three steps:
- Transfer the clean patch (
git diff). The system takes only the textual changes to the files and applies them to a pristine copy of the repository in a separate container. If the agent installed an extra library or created a temporary file but did not include it in the patch, it will not be present in the evaluation environment. - Run two groups of hidden automated tests:
- New task-specific checks (
FAIL_TO_PASS): tests that failed on the original code but must now pass. In our example, they check that--dry-runprints the correct new filenames while leaving the files on disk untouched. - Regression checks (
PASS_TO_PASS): existing project tests that ensure the agent has not broken normal renaming without the flag.
- Strict binary scoring. The verifier does not care whether the agent’s code matches the author’s solution word for word; it checks the program’s behavior through automated tests. If every required check passes, the task receives
1. If even one test fails, it receives0.
This produces pass@1: the share of tasks solved on the first independent attempt.
Note that “one attempt” in
pass@1means one isolated agent run, from receiving the task to submitting the patch. Within that run, the agent may take dozens of terminal steps, break and fix the code several times in local testing—the final patch is all that counts.
Google’s table gives Argon 77.9% and Opus 5.5 74.2%. But Google’s methodology reveals that these numbers were obtained under different conditions: Google ran Argon itself using mini-swe-agent, took Astra’s result from a public leaderboard, and sourced the Claude figures from Anthropic’s model cards. Before attributing the entire 3.7-point gap to the model’s intelligence, it’s worth checking how much the harness settings differed.
The verifier itself can also be a problem. Epoch AI’s audit found issues in at least 23 of DeepSWE’s 113 tasks. Failures most often occurred at the boundary between environments: when an agent changed the project’s test files, applying its patch and restoring the reference tests caused Git conflicts, leading the evaluation script to reject potentially valid solutions. This does not justify a blanket “minus 20 points” correction to every result, but it clearly shows that the checking program can make mistakes too.
Terminal-Bench Science: perform a scientific task in a terminal
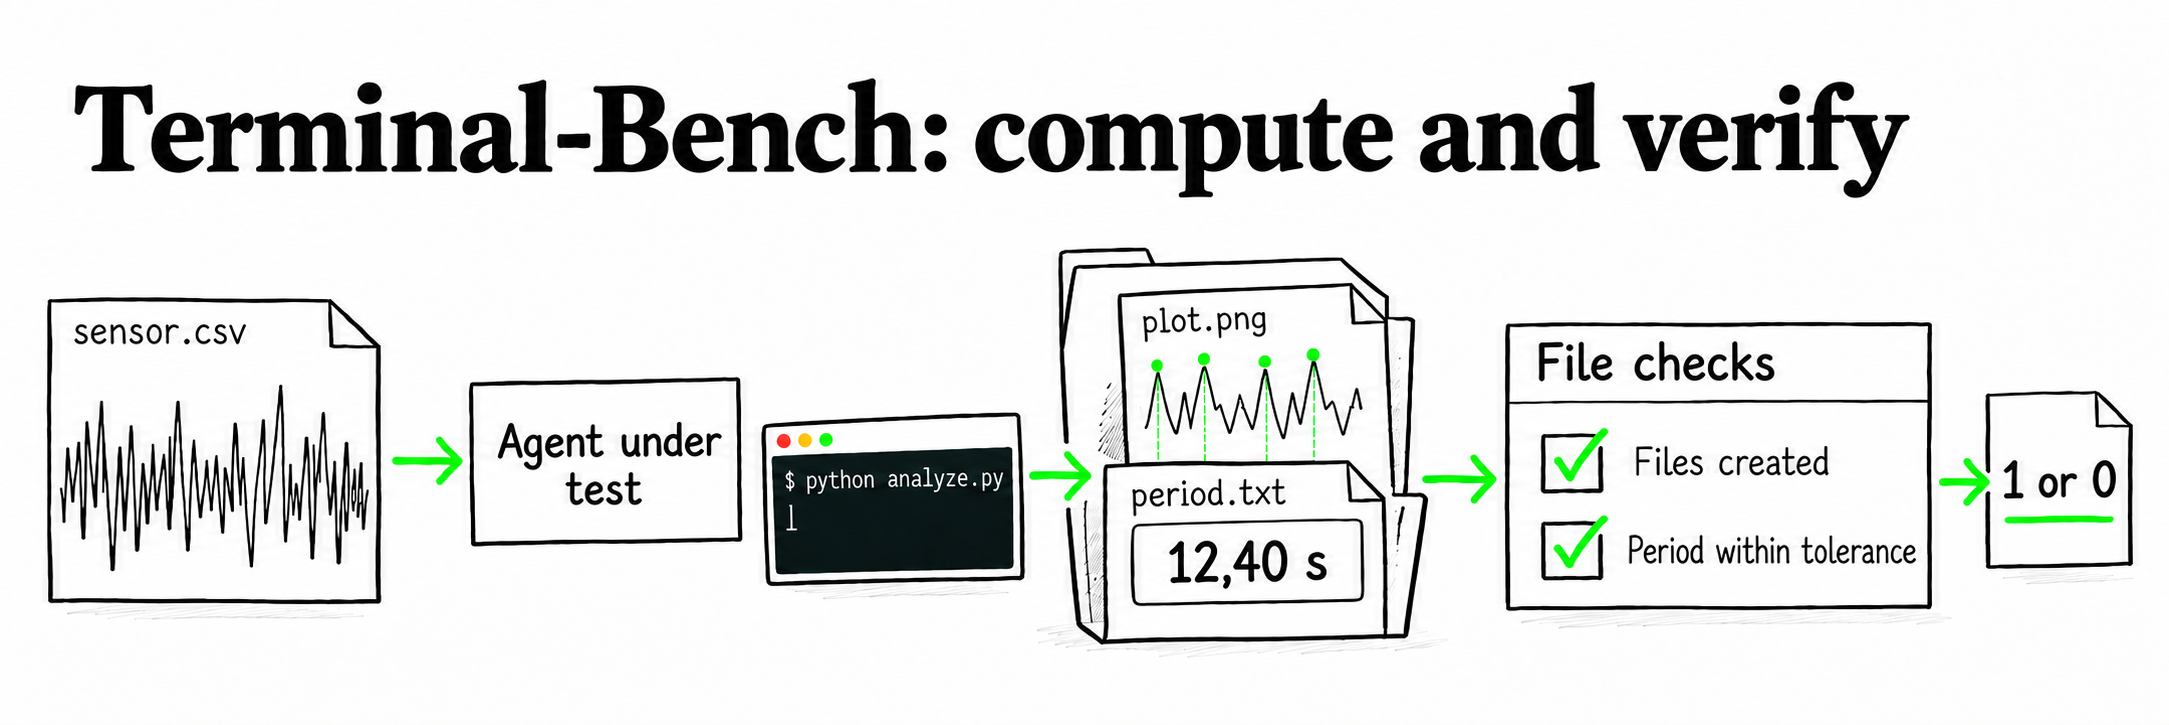
Instead of modifying software, let’s give the agent a research calculation. Its working folder contains sensor.csv, a file of noisy signal measurements, and the task says:
Find the signal’s dominant period in seconds, write the number to
period.txt, and save a plot of the original time series with its peaks marked asplot.png.
A text answer with a polished explanation of the formula is not enough. The agent must choose a noise-filtering method, write a script, run it on the actual data and leave the completed files in the folder.
Terminal-Bench Science 0.1 contains 70 such tasks across scientific fields, from physics and chemistry to bioinformatics. The agent works through a terminal in a prepared Linux environment: it writes Python or C++, runs calculations, examines the output and adjusts its solution.
How verification works:
Task + data in a folder → agent's terminal calculations → output files → verifier script → 1 or 0
Once the agent finishes, a custom verification script, written by the authors of that particular scientific task, enters its working directory:
- Check the generated artifacts. The script checks whether
period.txtandplot.pngexist at the required paths, whether the image can be read and whether the data follows the required format. - Compare the numerical answer within a tolerance. Scientific calculations rarely match down to the last decimal place, so the verifier checks whether the result falls within an allowed error range—for example, a reference of
12.40s with a tolerance of ±0.05s. For complex tasks, the verification script may itself run an expensive simulation or recompute a physical model using parameters found by the agent. - Strict task scoring. If every condition in the author’s script is satisfied, the task receives
1. If even one condition fails—or the checking script itself runs out of time—it receives0.
Notice the two independent timers in this setup: agent runtime (how many minutes the model gets to work in the terminal) and the verifier timeout (how long the checking script gets to evaluate the completed files).
That second timer explains a notable footnote in Google’s report: for its Argon run, the company increased the verification program’s timeout sixfold. If the checking script runs heavy computations and hits its normal time limit, the agent receives a technical 0 even for a correct solution.
As a result, three noticeably different scores appear for the same Argon model on Terminal-Bench Science 0.1:
| Publication | Argon score | Known run conditions |
|---|---|---|
| Original Google table | 57.6% | Google’s own run, verifier timeout increased ×6 |
| Vals leaderboard | 44.29% | Independent Vals run using mini-swe-agent |
| Carbon table | 52.9% | Result sourced from Artificial Analysis |
The model and benchmark name are identical in all three rows, but the measurements differ. Google does not disclose every parameter of its internal run, Vals has its own harness and repetition rules, and in the Carbon methodology, Google switched from its own measurement to Artificial Analysis figures. We cannot attribute the difference between 57.6% and 44.29% solely to the sixfold timeout increase; that would require changing only this parameter while holding everything else constant. But the practical lesson is clear: a benchmark name alone, without harness and verifier settings, does not define a common comparison scale.
Harvey’s Legal Agent Benchmark: prepare a document against a checklist
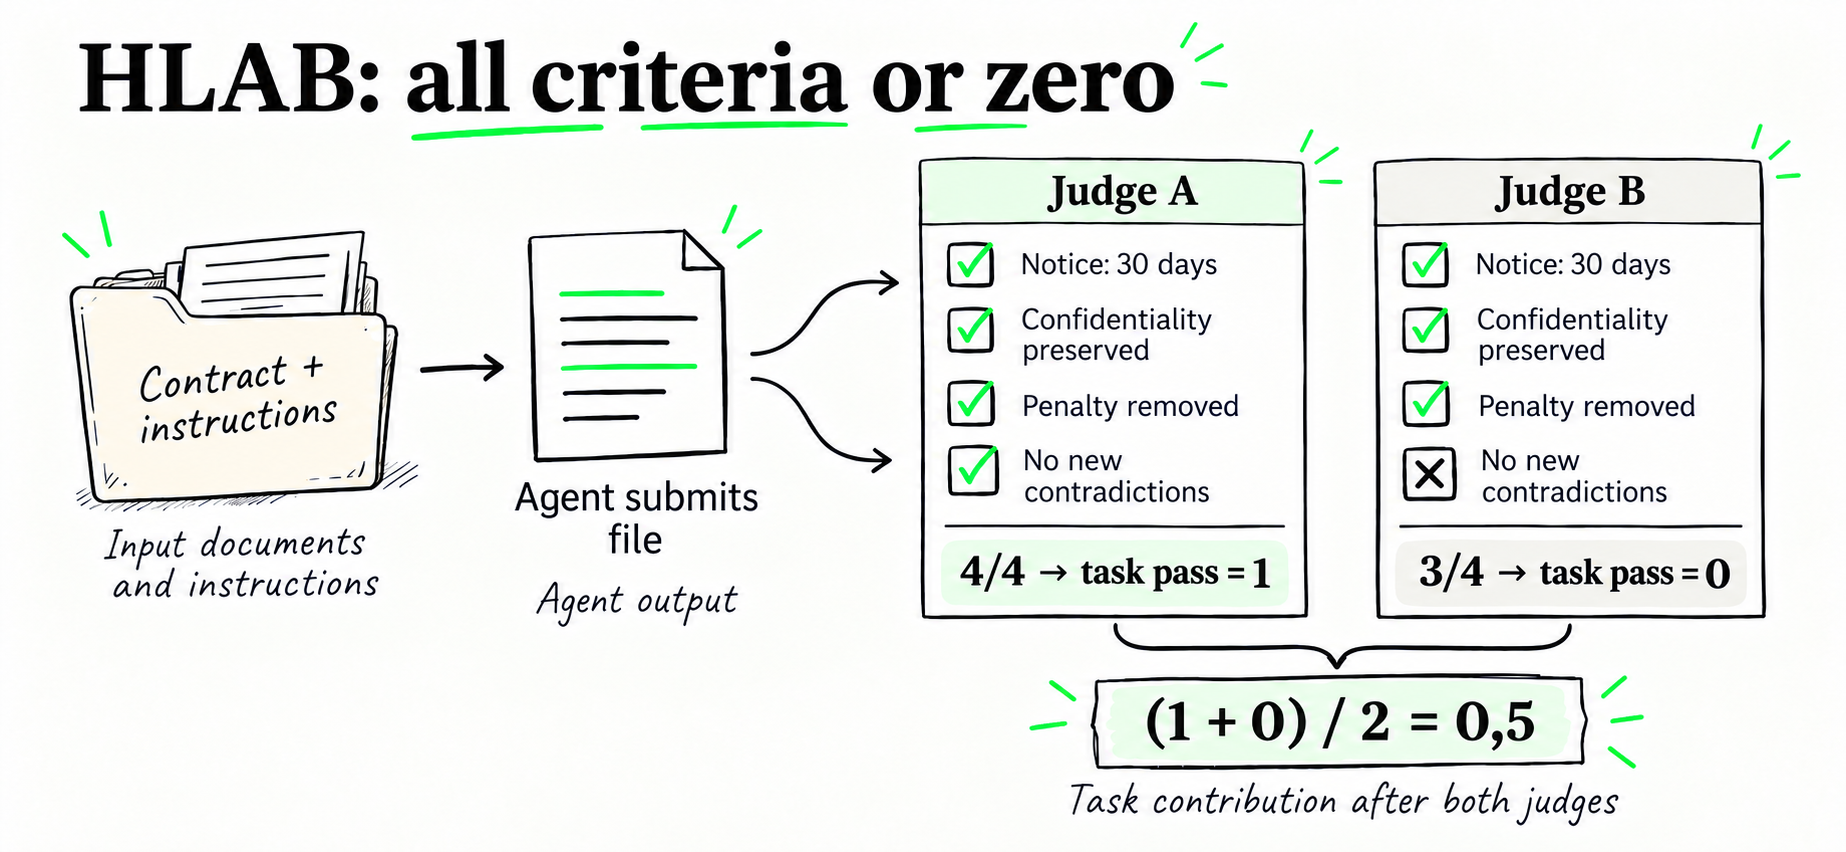
Let’s move from code to documents. Imagine a folder containing a draft software development contract and an email from the client. The lawyer’s assignment is:
Amend the contract: set the notice period for unilateral termination to 30 calendar days, leave the confidentiality section unchanged, remove the early-exit penalty clause and save a clean final document.
In Harvey’s Legal Agent Benchmark, the agent receives legal assignments like this along with case materials. Saying “I’ve fixed everything” in chat is not enough. It must edit and submit completed files without introducing contradictory terms of its own.
How verification works:
Assignment + case files → agent edits document → 2 judge models check the rubric → 100% of criteria = 1, otherwise 0
A simple string-matching script cannot evaluate a legal contract: the same legal provision can be correctly expressed in a dozen different ways. So the archived Vals v1 protocol—the source of the 19.6% in Argon’s table—uses an expert rubric and two judge models:
- An expert checklist (rubric). For each task, lawyers prepared specific checks in advance: what must appear in the final document, what must remain untouched and what must be absent. Suppose our example has four criteria:
- The termination notice period is changed to 30 days.
- The wording defining confidential information is fully preserved.
- The early-termination penalty clause is removed.
- The structure and numbering of the contract’s other sections remain intact.
- Independent review by two judges. Two different LLM judges independently read the agent’s document and mark each of the four criteria as passed or failed.
- An all-or-nothing rule for the task (Task Resolution). For an individual judge, the whole task receives
1only if the agent satisfies every criterion for that assignment: four out of four. If it handles three perfectly but forgets to remove one sentence about the penalty, the judge gives the entire task0. - Average the two judges’ scores. The task’s final score is the arithmetic mean of the judges’ verdicts. If Judge A accepts all four requirements (task score
1) but Judge B finds a flaw in one (three out of four, task score0), the task contributes(1 + 0) / 2 = 0.5to the benchmark.
This mechanism explains the huge gap between two metrics from the same run on the archived Vals page: about 94.0% on individual criteria but just 19.6% on full task resolution. The model meets more than nine requirements out of ten, yet makes at least one slip in almost every long document—and receives
0under strict task scoring.
Vals later released HLAB-Vals-1.1, in which Argon’s strict score rose from 19.6% to 27.08%. The model itself had not changed between measurements: the benchmark authors cleaned up data errors, fixed the harness and changed judge aggregation rules for the auxiliary metric. The increase across versions therefore reflects repairs to the measuring instrument, rather than a smarter model.
In practical use, what matters most is which criteria the agent gets wrong. Missing a minor formatting requirement and dropping a crucial liability clause both receive the same 0 in the benchmark, but carry very different risks in a real transaction.
GraphWalks: follow connections through a long text
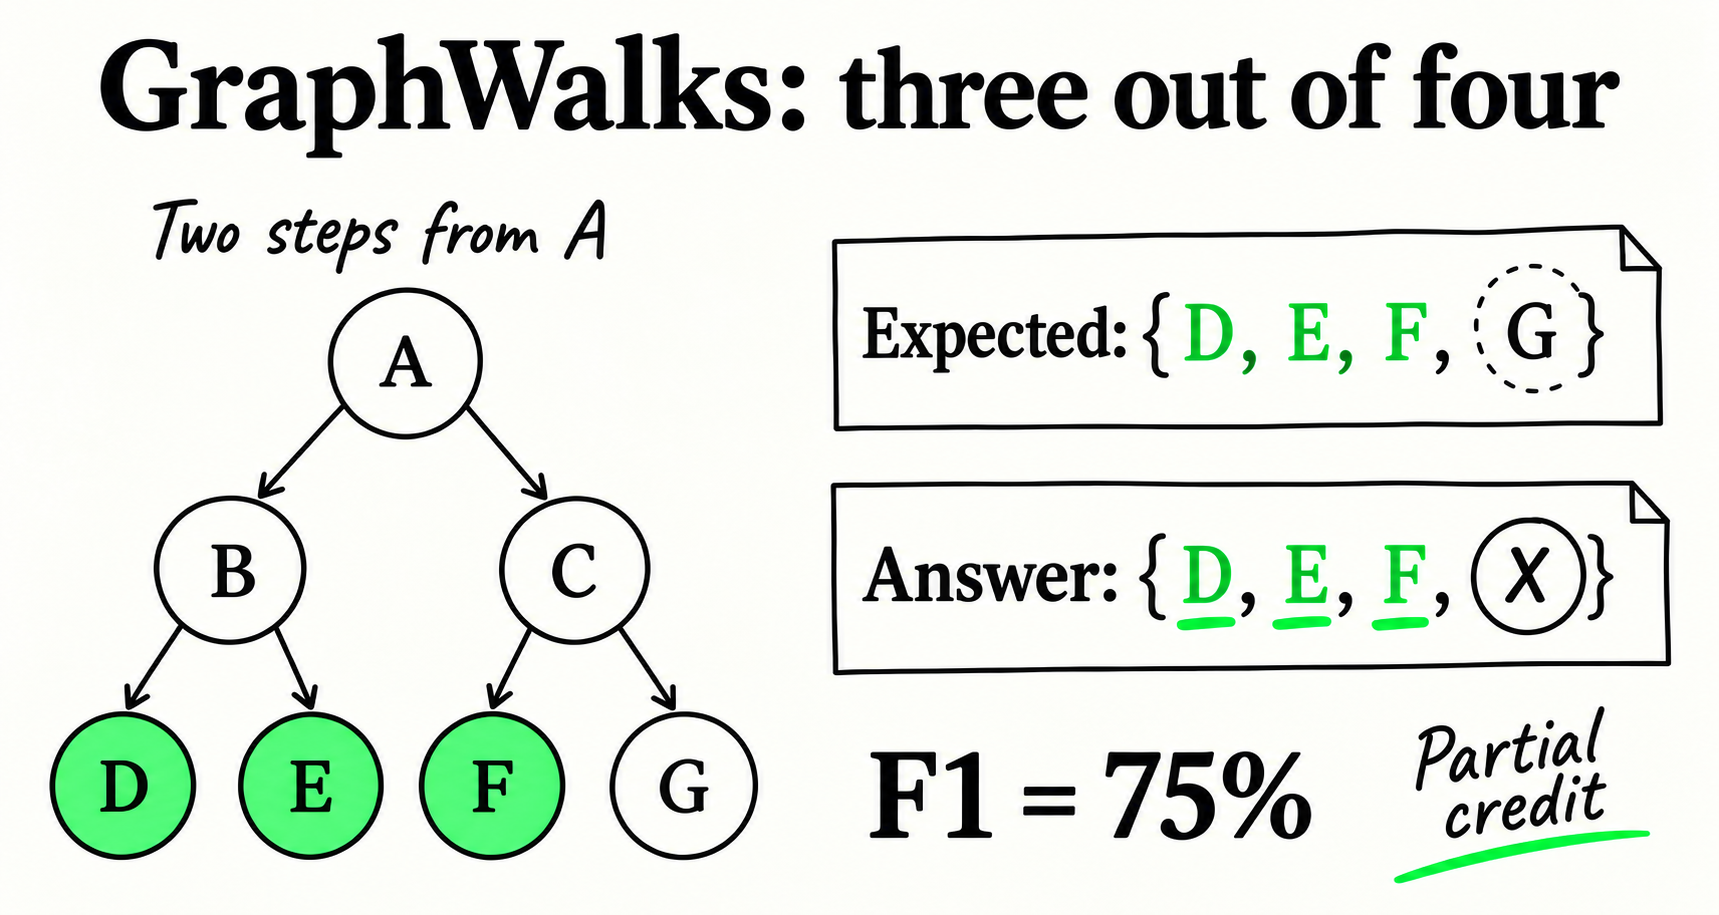
There is no terminal or file editing in this test. It measures the model’s ability to retain and connect facts within an enormous context window.
Imagine a simple network of flights between cities, written as text:
City A has direct flights to B and C. From B, you can fly to D and E. From C, to F and G. Question: which cities can you reach from A in exactly two flights (at a depth of two hops)?
Draw the network on paper and the answer is obvious: one step takes us to {B, C}, and the second takes us to {D, E, F, G}. The first-level cities, B and C, do not belong in the answer.
GraphWalks gives the model the same breadth-first search (BFS) task, but at an extreme scale. Instead of seven clear letters, the input is up to a million tokens long, with thousands of graph edges and random identifiers such as 8f3a -> 19c4 listed in a mixed order. Python calls are not allowed: the model must follow the chains of connections in the text and return the final node list in a single response.
How verification works:
Long text graph + question → model's node list → set comparison (precision and recall) → F1 score
There are no judge models here. A deterministic formula checks the answer using F1, which gives credit for partial overlap between two lists:
- Compare with the reference set. Suppose the correct answer in our example contains four nodes:
{D, E, F, G}. The model returns four nodes too:{D, E, F, X}. It found three correct nodes, missedGand incorrectly addedX. - Calculate precision and recall:
- Precision is the fraction of returned nodes that are correct: three out of four (
75%). - Recall is the fraction of required nodes the model found: three out of four (
75%).
- Precision is the fraction of returned nodes that are correct: three out of four (
Calculate F1. The harmonic mean of precision and recall gives this answer 75% (0.75 points). See Epoch AI’s detailed explanation of the metric.
Notice the difference in scoring strictness: in DeepSWE or Harvey’s legal test, an answer with one missing detail and one extra insertion would receive
0. In GraphWalks, it earns 75% credit. So the final 84.2% in the table does not mean the model solved 84.2% of the graphs perfectly; it is the mean F1 across the sample.
In Argon’s table, the test is split into two independent rows by input length: the model scores 99.7% on texts up to 128K tokens, and 84.2% on the long range of 256K–1M tokens, versus Astra’s 71.8%. Carbon’s release removed the short row and showed a jump on the long range (256K–1M tokens, BFS F1): 96.2% for Carbon versus 84.2% for Argon.
A precise methodological label such as “BFS F1 at 256K–1M” is much more honest than the marketing promise “the model understands a million tokens.” It states exactly what was tested: how the model collects connected identifiers throughout its context window. That is not enough for analyzing a real hundred-page contract, where the model must also handle ambiguous wording and assess the risk of each omission.
LVBench: answer a question about a long video
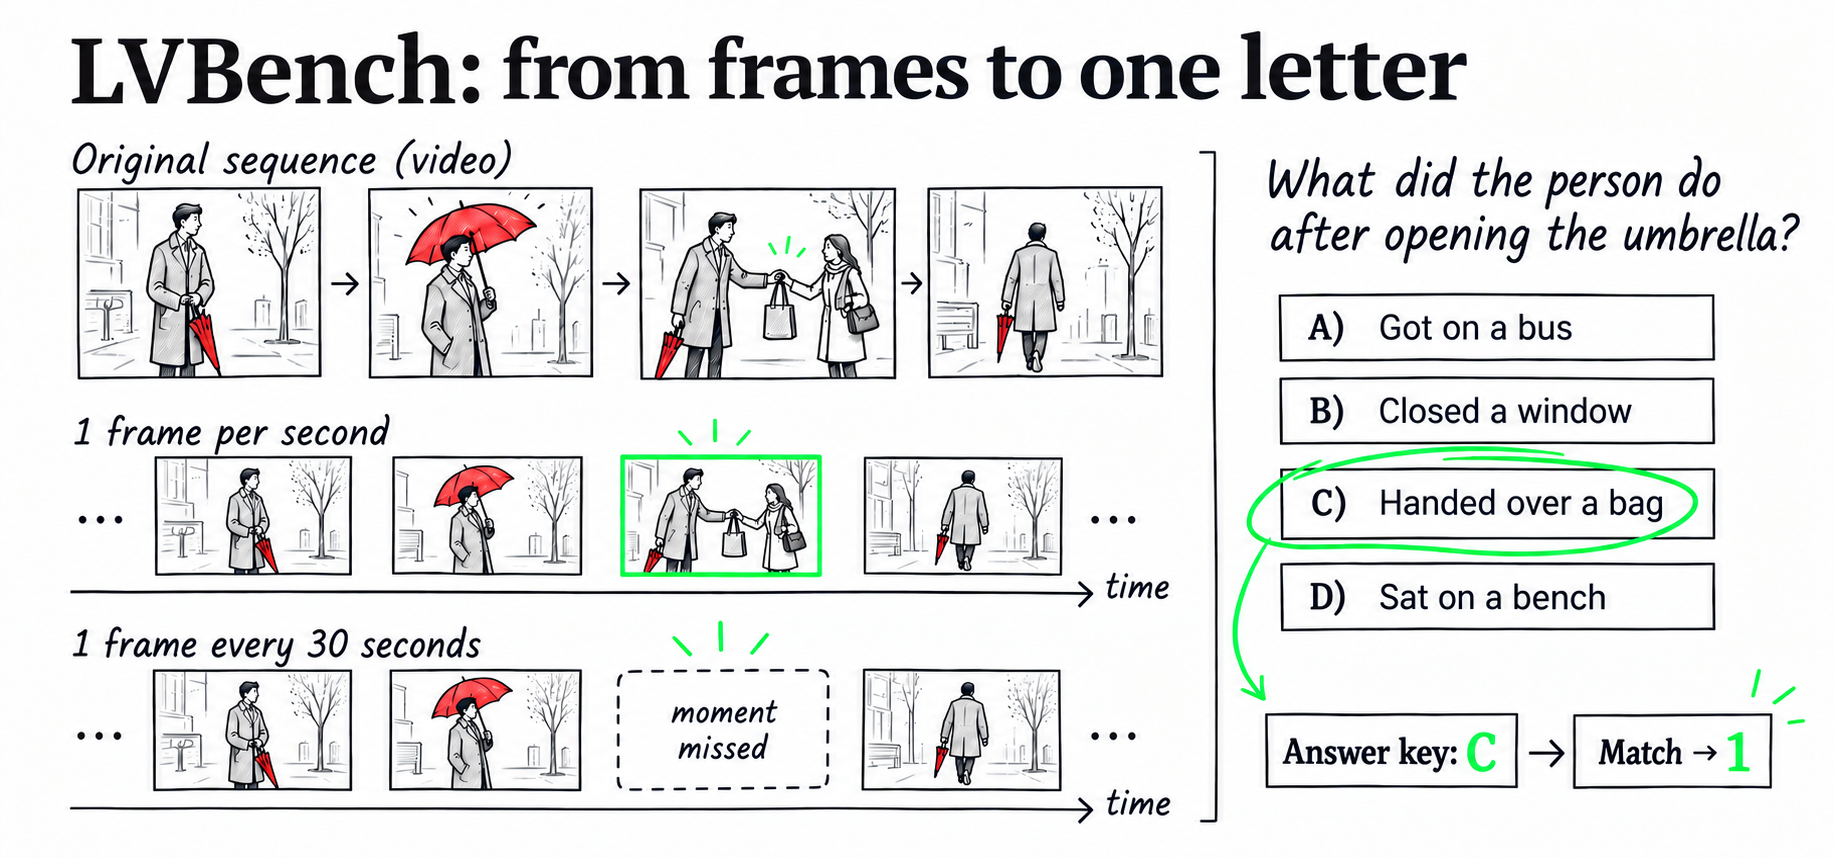
Imagine an hour of footage from a street camera. At minute 24, a person in a coat opens a red umbrella for a couple of seconds, closes it and immediately hands a bag to a passerby. The model receives a question with four possible answers:
What did the person do immediately after opening the red umbrella?
- A) Got on a bus
- B) Closed a window
- C) Handed over a bag
- D) Sat on a bench
LVBench works exactly this way: it is a set of multiple-choice questions about long videos, ranging from tens of minutes to several hours. The test checks the ability to locate and connect visual events over time, rather than transcribe a call’s audio track.
How verification works:
Video → frames sampled before the run → choose A/B/C/D → compare with answer key → 1 or 0
The evaluator itself is extremely simple. The interesting part happens before the model sees the question:
- Step 0. Prepare the input (frame sampling). Modern models do not watch an hour-long file as a continuous film. The harness first extracts individual image frames and feeds them to the model.
- Step 1. Choose an answer. The model analyzes the supplied frames and returns one letter:
Cin our example. - Step 2. Check the answer key. The verifier compares the model’s letter with the correct answer in the annotations. A match gives
1, otherwise0. The final accuracy is simply the percentage of correct answers.
In Argon’s table, Google’s model scores 91.7%, versus 87.5% for Astra. But the testing footnote reveals a crucial difference at step zero: Gemini received video sampled at one frame per second (1 FPS), while Astra, Opus and Fable had hard limits of 800, 600 and 300 frames for the entire video, respectively, because of their API restrictions.
Consider the arithmetic: an hour-long video contains 3,600 seconds. At one frame per second, the system receives 3,600 consecutive samples; a two-second bag handover is captured in two images. With a budget of 300 frames for that same hour, images are sampled every 12 seconds. A brief action can easily fall into the blind spot between neighboring frames: the model never sees a bag in the pictures and has to guess among four options.
We cannot claim that the entire gap between 91.7% and 87.5% comes from frame density alone: Google does not disclose every detail of preprocessing and image compression. But when one system receives a detailed storyboard and another gets sparse screenshots, the test measures both the model’s video understanding and the throughput of its interface.
LVBench disappeared from the new Carbon table, but the lesson applies broadly: for any multimodal test, always check the resolution and frame rate at which the model was allowed to see the source material.
OSWorld: complete a task on a computer
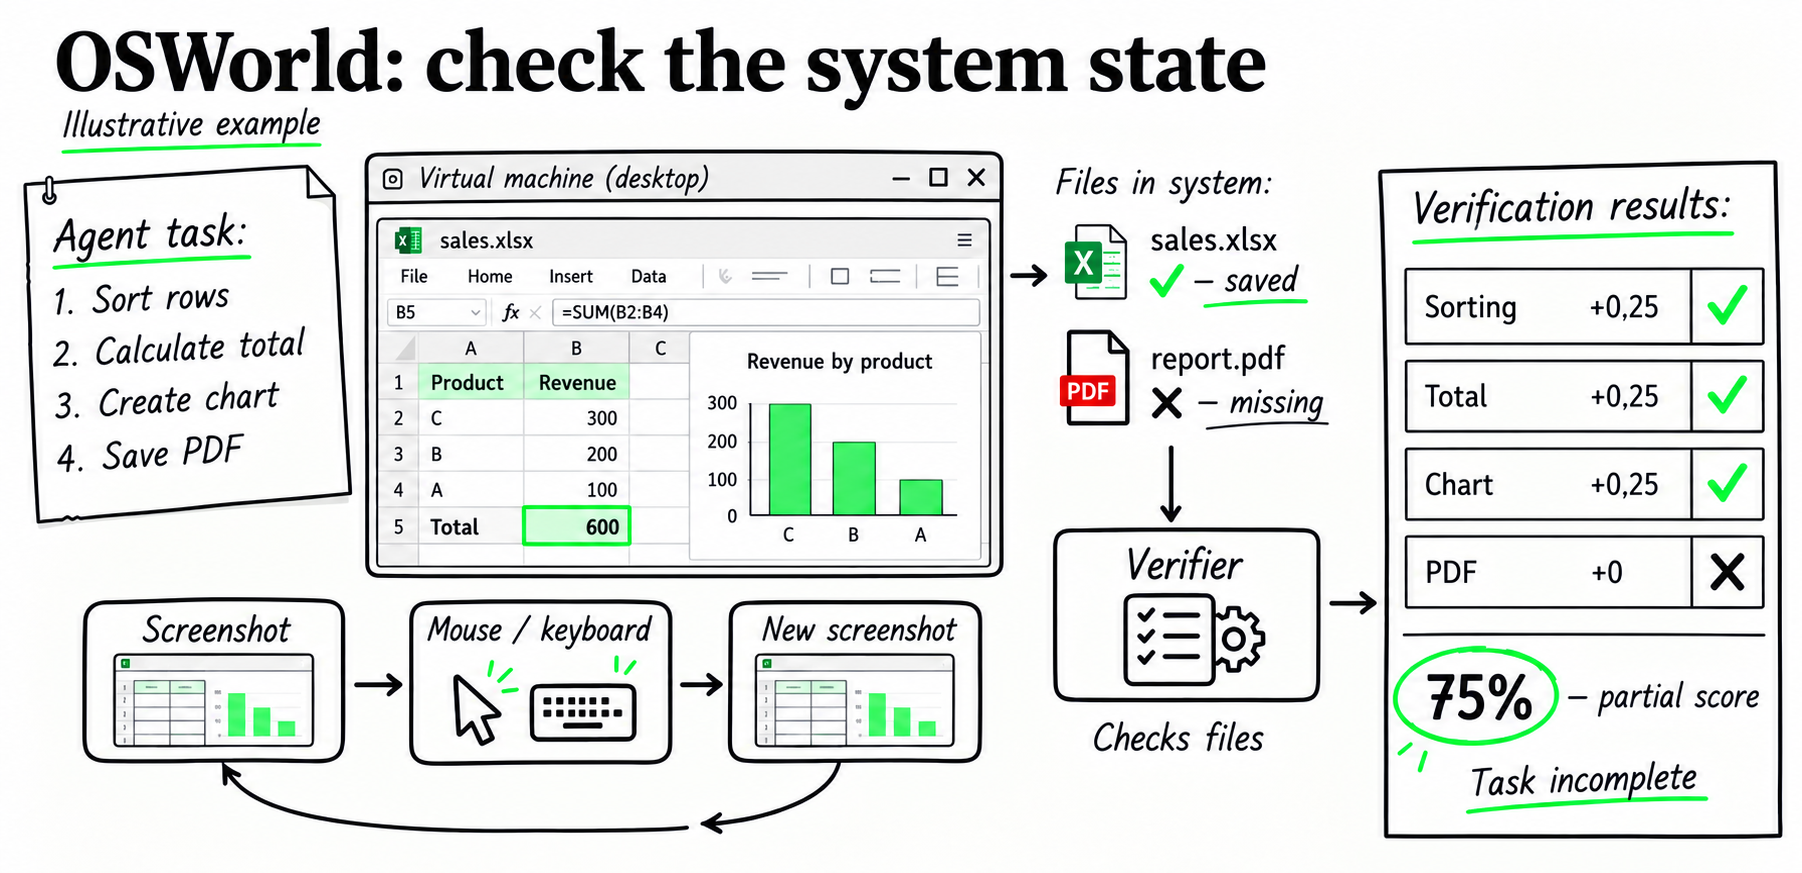
Now let’s put the agent in front of an ordinary operating system’s graphical interface and give it an office task:
Open the sales spreadsheet on the desktop, sort rows by revenue in descending order, calculate the total in the bottom cell, create a chart and export the finished report to
report.pdf.
In OSWorld, the agent works inside a real virtual machine. In Google’s configuration, it sees the screen through screenshots and controls the computer with a virtual mouse and keyboard: clicking icons, opening menus, entering text and saving files.
How verification works:
Assignment + virtual machine → screenshot–click loop → script checks files and OS state → score from 0 to 1
The OSWorld evaluator does not track the cursor’s path or penalize the agent for opening the wrong menu first. When the agent says it has finished—or exhausts its step budget—a verification script runs inside the virtual machine and checks the system’s final state:
- Inspect artifacts and settings. The script directly reads saved files, application configuration records, database contents or open windows.
- Combine weighted checkpoints (Partial Score). In many OSWorld tasks, the score combines several checkpoints with predefined weights. Suppose our illustration has four equally weighted checks, worth
0.25each:
- The spreadsheet rows are sorted correctly:
+0.25. - The bottom cell contains the correct total:
+0.25. - The sheet contains a chart using the required columns:
+0.25. - The file
report.pdfexists on disk:0. The agent saved the spreadsheet but forgot to click “Export to PDF.”
- Partial credit without completing the task. This attempt receives 0.75 points (75%), even though the user’s final goal—getting a PDF file—was never achieved. In the actual OSWorld set, rules and weights depend on the task: some scores are binary (
0or1), while others are fractional.
Argon’s table reports 69.2% on the offline OSWorld 2.0 snapshot. This is a mean score that includes partial credit, rather than the share of assignments completed from start to finish. Google’s footnote also specifies maxed over 3 runs with a single attempt per run. The public wording does not fully clarify whether this means the best of three complete benchmark runs or the best of three attempts for each individual task.
Carbon’s release adds a telling example of conditions changing between releases. The new table uses OSWorld 2.1, with 81.5% for Carbon and 74.7% for the older Argon, rather than its previous 69.2%. The Carbon methodology explicitly says that the agent harness was updated along with the benchmark version: it now provides a history of previous screenshots.
The comparison looks like this:
Argon in the old table (OSWorld 2.0, old harness): 69.2%
Argon in the new table (OSWorld 2.1, screenshot-history harness): 74.7% (+5.5 percentage points without changing the model)
Carbon in the new table (OSWorld 2.1, screenshot-history harness): 81.5% (+6.8 percentage points from the new model)
Simply comparing 69.2% from September’s announcement with 81.5% from October’s would attribute almost twice as much improvement to the new model as the comparison under the same harness actually shows: 74.7% → 81.5%.
Vals Index: combine several tests into one score
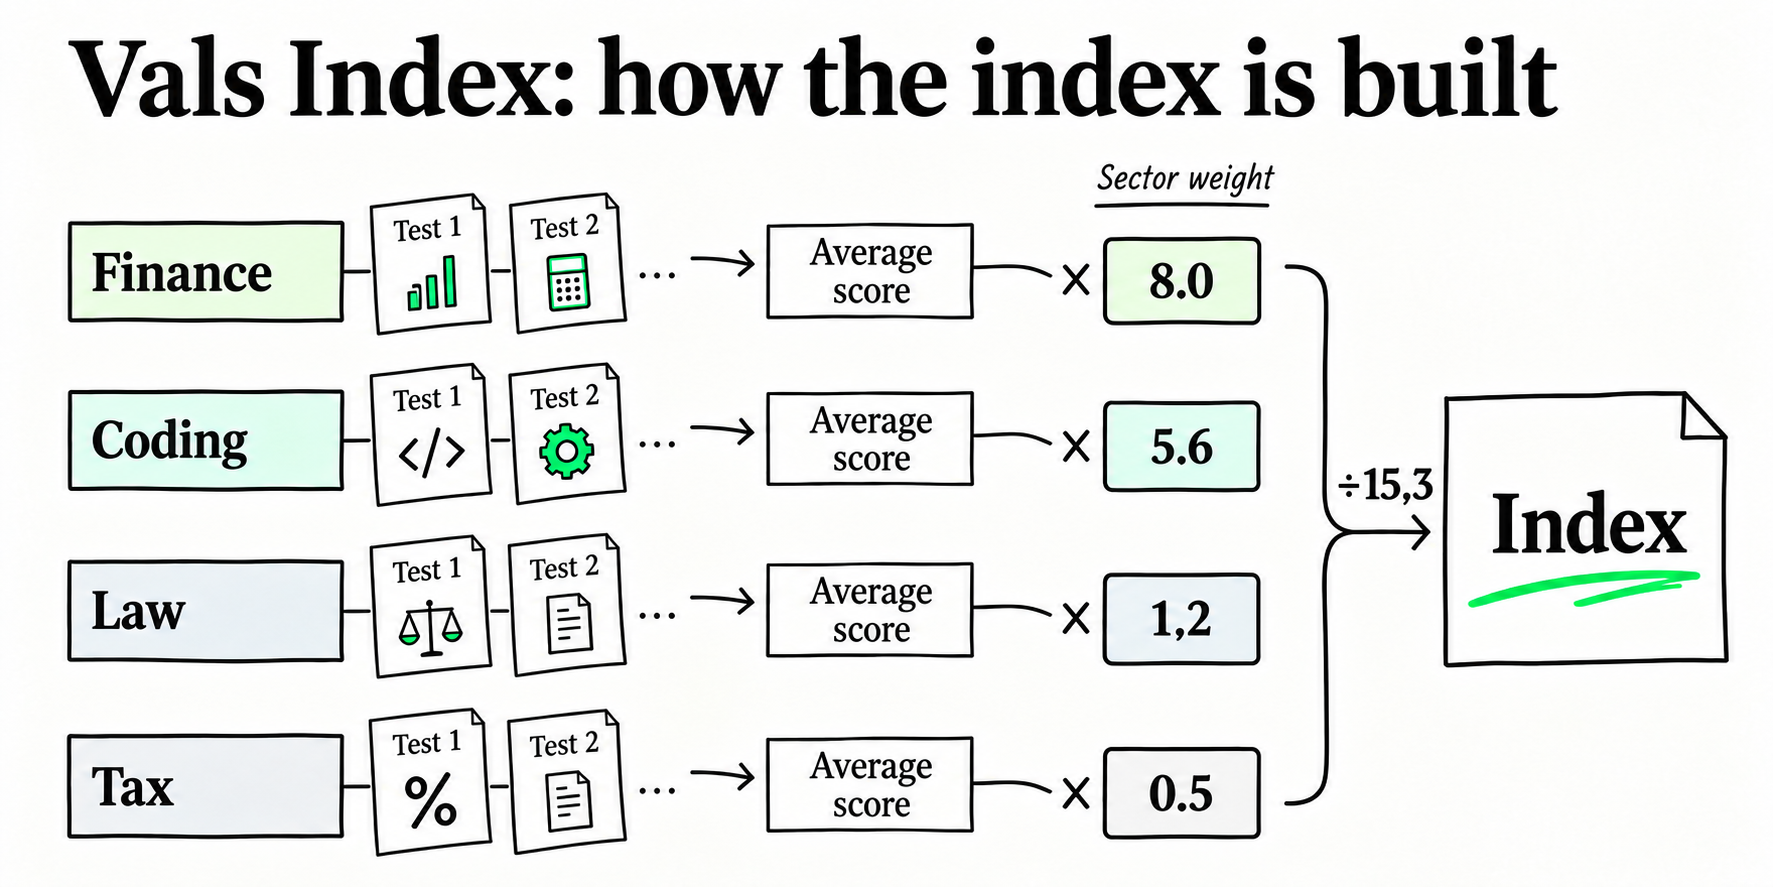
Unlike the previous six entries, Vals Index is a composite ranking—an aggregator—rather than a separate test with its own tasks. It combines benchmark results across four sectors: finance, coding, law and tax.
Imagine assessing a candidate on four professional exams, but multiplying each subject’s score by that industry’s share of US GDP when calculating the overall result.
How scoring works (verification at the index level):
Individual benchmark scores → mean for each of 4 sectors → weighted sum using US economic shares → final index
The index has no verification script of its own. Each component test uses its own rules; the legal basket, for instance, includes the HLAB test discussed above. The index then calculates the final number in two steps:
- Step 1. Average within sectors. Results from all tests in one field—for example, several financial benchmarks—are averaged into a single sector score.
- Step 2. Combine using sector weights. In Vals Index v2.1, sector scores are combined using weights proportional to the size of those sectors in the US economy. The weights sum to
15.3: - Finance: weight
8.0(~52.3% of the final index); - Coding: weight
5.6(~36.6%); - Law: weight
1.2(~7.8%); - Tax: weight
0.5(~3.3%).
The numbers show that finance and coding determine almost 89% of the entire index, leaving law and tax together at about 11%. If a model makes a breakthrough on legal tasks and gains ten points there, the overall Vals Index moves by less than 0.8 points. A gain of just two points on financial tests raises the overall ranking more.
These weights make sense for a macroeconomic market overview, but may be useless for your particular product. If you are building a service for tax advisers or lawyers, a high composite score driven by financial mathematics says nothing about model quality on your tasks.
Composite indices also make three other release-table practices easy to see:
- Changing the index version between releases. Argon’s table reports 68.9%, matching the archived Vals Index v2.1 figure of 68.90%. Carbon’s table is labeled Vals Index v2.2, with an updated set of components: Carbon scores 70.4%, while Argon’s recalculated score is 69.2%.
- Selecting which competitors appear. In Carbon’s table, Google compares its model with selected competitors but leaves out Claude Sonnet 5.5. Open the full Vals Index leaderboard as of October 29 and Sonnet 5.5 is first at 70.85%, with Carbon second at 70.36%. First place among the columns in a press release does not always mean first place in the market.
- The hidden cost of a point. A composite index shows final accuracy but says nothing about the time and tokens spent reasoning. In another popular aggregator, the Artificial Analysis Intelligence Index (September 30 analysis), Argon and Astra both scored 53 points. Yet Argon used about 62K output tokens per task on average, versus 27K for Astra—more than twice as much generation. Carbon’s October table also updated this index to v5.0, where Carbon scores 59 points and Argon 50, rather than its previous 53.
An alternative to other people’s tables: benchmark your own code
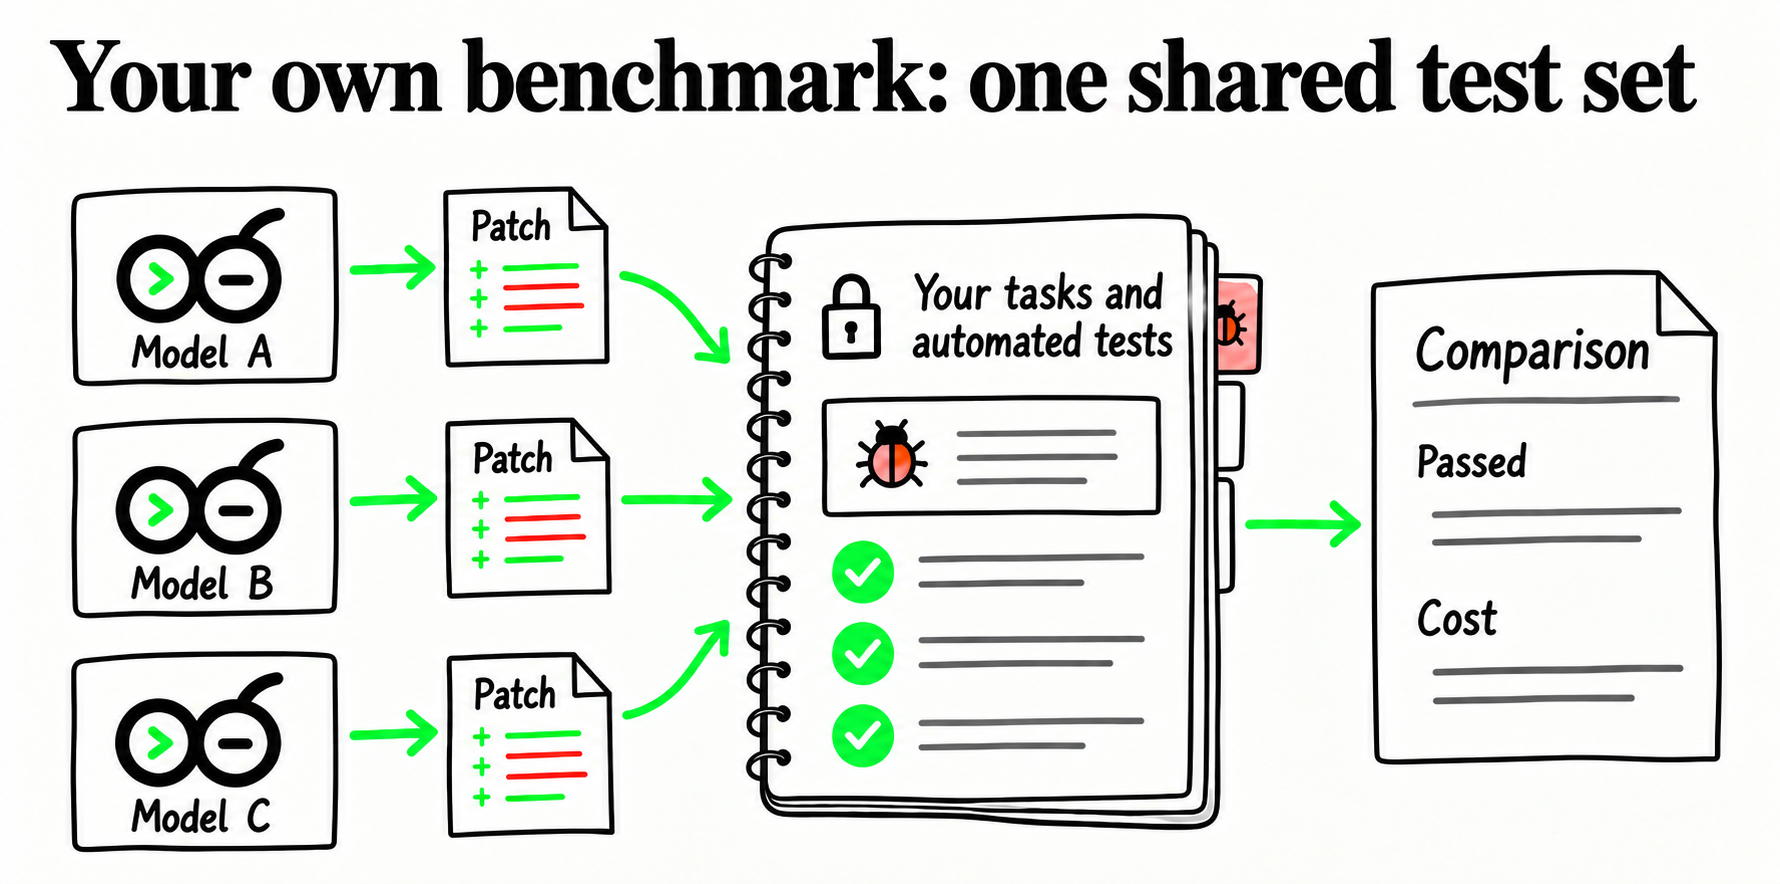
Instead of making engineering decisions from someone else’s press release, a much more reliable approach is to spend an evening turning your own working code and private tasks into a personal benchmark.
The idea is simple: every project already has a testing ground—a private repository, a history of fixed bugs, automated tests and real issues from the tracker. No model has seen your private codebase during training, so it cannot copy the answer or coast on a memorized template.
Set up this evaluation environment once, and every major release brings two practical benefits:
- An objective assessment of new models in 15 minutes. When a hypothetical Gemini 4 Carbon or a new Claude comes out, you do not need to guess how honest the presentation’s percentages are. Run it on your 30 private tasks and check the actual pass rate within your architecture.
- Lower costs without sacrificing quality. In practice, a fast, cheap model at $0.50 per million tokens may achieve the same 85% pass rate on your particular pipelines as a heavyweight frontier model at $15, or solve the task in a third as many steps. Your own benchmark lets you move production to a cheaper model using hard numbers rather than intuition.
You do not have to build this environment entirely by hand. Open tools and simple approaches already exist for generating benchmarks directly from your repository:
- SWE-smith, from the creators of SWE-bench at Stanford / Princeton: an open toolkit that turns a GitHub repository into its own arena (
SWE-gym). It sets up the project’s environment, takes working code, automatically generates realistic faults—or reverses earlier pull requests and commits—selects tasks guaranteed to break one or more of yourpytesttests, and packages everything into a ready-to-use evaluation set. - R2E (Repository to Environment): a framework that scans a repository, uses static analysis to extract the relevant dependency slice, and automatically builds equivalence test harnesses around your functions. It can help even when a project has few handwritten unit tests and you need to check whether a new model can extend or optimize a method without changing its behavior.
- The “time machine through your own PRs” approach (
git reverteval): the quickest option without external libraries. A script takes 20–30 real private pull requests from recent months where a feature or bug fix included a test. It rolls the implementation back to the parent commit (git checkout <parent_commit>) but keeps the new test, then gives the agent the original tracker issue as its prompt.
Conclusion
A percentage in a table describes performance on a particular benchmark under particular verification rules. It is not a universal model rating.
In GraphWalks and OSWorld, an incomplete answer can earn as much as 75% credit. In Terminal-Bench Science, the score depends on the checking script’s timeout; in LVBench, on frame sampling frequency; in OSWorld 2.1, on whether screenshot history is provided. Vals Index applies sector weights, while the same Intelligence Index score can require more than twice as many output tokens from one model as another.
Users do not need to understand every checking script. What matters is that benchmark comparisons are possible when measurement conditions are disclosed and results can be reproduced. The people producing the measurements should provide that transparency. In the next article, we’ll examine platforms and organizations that independently evaluate models: what they test and the rules they use to compare results.
Sources
- LiveCodeBench: Holistic and Contamination Free Evaluation of LLMs for Code and the interactive LiveCodeBench leaderboard
- SWE-Lancer: Can Frontier LLMs Earn $1 Million from Real-World Freelance Software Engineering? (OpenAI), the SWE-bench Pro leaderboard (Scale AI) and Epoch AI’s analysis of SWE-bench Verified tasks
- Gemini 4 Argon model card and Argon evaluation methodology (Google DeepMind)
- Gemini 4 Carbon announcement, Gemini model overview and Carbon evaluation methodology (Google / DeepMind)
- DeepSWE repository and Epoch AI’s review of DeepSWE verification issues
- Terminal-Bench Science 0.1 announcement and its Vals AI benchmark page
- Harvey’s Legal Agent Benchmark announcement, archived HLAB v1 protocol and updated HLAB-Vals-1.1
- GraphWalks dataset (OpenAI) and Epoch AI’s review of the GraphWalks metric
- LVBench repository
- OSWorld-V2 repository
- Vals Index v2.1, the current Vals Index leaderboard and Artificial Analysis’s Gemini 4 Argon analysis
- Tools for building benchmarks from your own code: SWE-smith and R2E (Repository to Environment)